Posts

Showing posts with the label forex trading signals

In yesterday's trading session, after falling to the 1915 price zone
Image
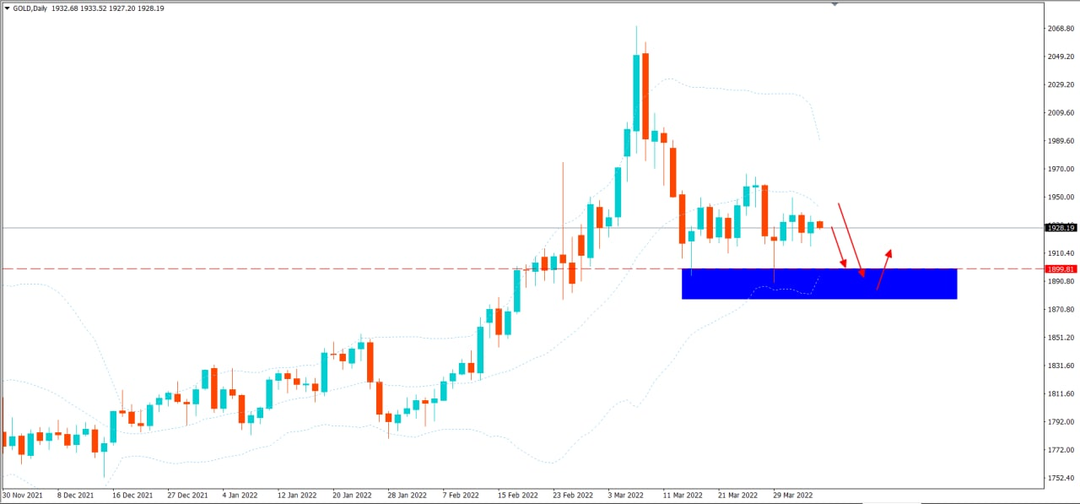
  Comment on Gold on 05/04/2022: - In yesterday's trading session, after falling to the 1915 price zone, precious metal Gold bounced up to 1936. Yesterday's session closed with a rising green candle, but this increase was insignificant and according to Gold will continue to move sideways in the range of 1938-1915. - My personal view in today's trading session is biased towards #sell . We can sell short at the upper edge of the 1930-1937 flat zone with a safe target around 1915-1920. Here we liquidate the order and wait for the signal. I will update later when there is a buying rhythm.

GBP/USD eyes break below 1.3100 and towards key support amid buoyant buck

Image
  GBP/USD is trading with a downside bias as the euro underperforms and 21DMA continues to act as a ceiling. A break lower to test last week’s 1.3050 lows looks on the cards, with bears also eyeing 1.3000 annual lows. Following hawkish Fed commentary over the weekend and ahead of possibly more this week, USD risks are tilted higher. In a relatively tame start to the week for currency markets, GBP/USD is trading with a downside bias and is currently threatening a downside break of the 1.3100 level. Sterling is likely weighed by underperformance in its cross-English Channel peer  the euro , which is underperforming ahead of the resumption of Russo-Ukraine peace talks later in the session and amid further chatter about a possible EU embargo on Russian energy imports. Commentary from BoE policymakers on Monday did not stray into the territory of monetary policy and thus hasn’t impacted cable, which probed last Friday’s lows in the 1.3080s earlier in the session and is eyeing a bre...

Singapore: Industrial Production remains robust – UOB

Image
   Economist at UOB Group Barnabas Gan reviews the latest industrial production figures in Singapore. Key Takeaways “Industrial production surged 17.6% y/y (+16.6% m/m sa) in Feb 2022, surprising market expectations for a 6.3% y/y (+5.7% m/m sa) growth. Excluding biomedical manufacturing, industrial production rose 16.8% y/y.” “The strong performance in Singapore’s manufacturing sector is underpinned by the global trade recovery, especially on the back of healthy semiconductor- and biomedical-related demand. Other factors that have supported Singapore’s manufacturing momentum also include the gradual reopening of international borders, which resulted in higher levels of maintenance, repair and overhaul activity from commercial airlines.” “In all, our  outlook  is for full-year manufacturing to grow by an average of 4.0% in 2022. This suggests that despite the high-base growth rate seen in 2021, global trade activity is expected to stay buoyant in the new year.”

forexadviseclub Expands Trading Services in Canada

Image
forexadviseclub  the brokerage brand owned by StoneX Group, announced on Wednesday that it has expanded its trading services in the Canadian market. Services in the market are being offered by the locally established GAIN Capital- FOREX.com Canada Limited but under its generic Forex.com brand. Its offerings are fully regulated as it is a member of the Investment Industry Regulatory Organization of Canada and also of the Canadian Investor Protection Fund. “Our mission at StoneX is to open markets, and this expansion of our FOREX.com offering in the Canadian market is an important part of providing comprehensive access to the retail investor,” said the CEO of StoneX Group, Glenn Stevens. Last October, the broker started offering its services in the Latin American markets  under a Cayman Islands license. Related content

Dollar in Demand; Euro Heads South With Traders Risk Averse

Image
 The U.S. dollar pushed higher in early European trade Tuesday, with the euro under pressure, with the intensifying conflict in Ukraine prompting demand for the world’s reserve currency. At 2:55 AM ET (0755 GMT), the  Dollar Index , which tracks the greenback against a basket of six other currencies, traded 0.3% higher at 97.660. Russian forces have intensified the bombardment of Ukrainian cities, warning residents of Kyiv to leave as a miles-long convoy of armored vehicles draws near to the capital. This is resulting in traders seeking out the dollar, the globe’s reserve currency, main safe haven, and most liquid asset. “Recent headlines that Russia is escalating nuclear preparations and that the west is imposing increasingly tough sanctions, including freezing assets and cutting off certain Russian entities from the SWIFT interbank communications network, suggest that the risk-off tone may linger throughout the week and potentially beyond,” said Matthew Weller, Global Head o...

The Reserve Bank of Australia is expected to withdraw from its government bond-

Image
 Investment institutions forecast the Conference on Interest Rates in Australia Goldman Sachs Group: The Reserve Bank of Australia may abandon its yield-curve policy, and the outlook for medium-term rate hikes could lag behind other G10 central banks. Nomura Securities: The Reserve Bank of Australia could replace the target bond with one maturing in April 2023, or offer a range of target rates. ANZ Bank: It is expected that the Reserve Bank of Australia will abandon its 0.1% yield control target on the national debt due in April 2024, and is expected to raise rates in  second half of next year. Westpac: It's not hard to control Treasury yields, but with damage mobile, the Reserve Bank of Australia won't set a yield control target for shorter-term Treasuries. Morgan Stanley: It is expected that the Reserve Bank of Australia will not emphasize the expected timing of rate hikes this week, but will emphasize clearer guidance on the future based on results. Commonwealth Bank of Aus...

AUD/USD Daily Resistance And Fundamentally Overview

Image
Weekly Time frame: AUD/USD bulls remain bound for prime resistance at $0.7849-0.7599, on track to forge a fifth consecutive week in the green since departing from prime support from $0.6968-0.7242 at the end of September. Trend studies on the weekly scale show we’ve been higher since early 2020. Consequently, the response from $0.6968-0.7242 might be the start of a dip-buying attempt to join the current uptrend, perhaps eventually overrunning $0.6968-0.7242 and challenging the yearly top at $0.8007. Daily Time frame: Resistance between $0.7621 and $0.7551—made up of a Quasimodo support-turned resistance at $0.7621, the 200-day simple moving average at $0.7557, as well as a 61.8% Fibonacci retrenchment at $0.7585 and a 100% Fibonacci projection at $0.7551—made an entrance on Thursday. Interestingly, noted resistance is fastened to the lower boundary of weekly prime resistance mentioned above at $0.7849-0.7599. A nearby decision point is seen at $0.7585-0.7567, which happens to sit ...

Germany - The Manufacturing Purchasing Managers Index (PMI) released by Markit

Image
WHAT IT INFLUENCES: EUR and its subsequent pairs Forex Advise Club WHAT'S HAPPENING: The Manufacturing Purchasing Managers Index (PMI) released by Markit economics, captures business conditions in the manufacturing sector. As the manufacturing sector dominates a large part of the total GDP, the manufacturing PMI is an important indicator of business conditions and Germany's overall economic condition. Typically, a result above 50 signals is bullish for the EUR, whereas a result below 50 is seen as bearish. Follow us to always know the science of Forex Trading as well as the latest updates on technical analysis & fundamental analysis https://www.forexadviseclub.com/

The Initial Jobless Claims released by the U.S. Department of Labor

Image
WHAT IT INFLUENCES: USD and its subsequent pairs WHAT'S HAPPENING: The Initial Jobless Claims released by the U.S. Department of Labor is a measure of the number of people filing first-time claims for state unemployment insurance. In other words, it provides a measure of strength in the labour market. A larger than expected number indicates weakness in this market which influences the strength and direction of the U.S. economy. If jobless claims fall, it is seen as positive or bullish for the USD. Follow us to always know the science of Forex Trading as well as the latest updates on technical analysis & fundamental analysis https://www.forexadviseclub.com/

Oil price forecast for today-

Image
Oil is trading in the correction to a short-term uptrend. Yesterday, traders tested the Additional Zone 80.00 - 79.87. This zone was broken out today. Now the price is rolling back up and testing the broken-out zone as resistance. I recommend considering oil sales in the zone of 79.87 - 80.46 with a target in the Intermediary Zone 78.72 - 78.46. It would be reasonable to take a part of profits at today's low. To enter purchases, it is required to break out the resistance zone 80.59 - 80.46. In this case, it will be possible to expect the price to reach level 81.13. Follow us to always know the science of Forex Trading as well as the latest updates on technical analysis & fundamental analysis https://www.forexadviseclub.com/

GOLD - From Monday’s chart to the current market.

Image
The rise in the market price that took place yesterday after being tested at the opening price of 1754.00 did rise up to the level of 1769.00 from this $ 15 increase is the market price today able to make an increase or even follow the original trend where the downtrend will occur following the big bearish in the past? From the current chart today, I see a rejection at the price of 1763.00 which is the first resistance area after the market opened this morning.  Continuing that, the price also has confluence on the trend line area in the M15 time frame tested. These are the support and resistance levels of gold today: R1: 1763.00 R2: 1769.00 R3: 1779.00  -------------------- S1: 1757.00 S2: 1751.00 S3: 1741.00   The price opened today at 1760.00, from Monday’s chart to the current market.  The majority of the movement is still in a horizontal position so looking from this potential, short term trading can be done in the following areas. Trading management 1: 1.5 to 1...

On the daily chart time frame we can see that Gold price -

Image
In yesterday's session, precious metal Gold fluctuated in a rather narrow range of 1761-1750 ($11), closing the session with a bearish candle, but the drop was not significant, just moving sideways in the morning.  the range is narrow and only when the two bands are broken will the trend be really clear. On the daily chart time frame we can see that Gold price is under downward pressure by the 20-day MA as the price is clinging to the descending MA20 and I personally lean more towards the downtrend of the precious metal Gold.  In the H4 time frame we can see that Gold is currently in the support of this sideways range and if the price breaks 1748-1750 to the downside, 1736-1740 will be the next level Gold is headed. Follow us to always know the science of  Forex Trading as well as the latest updates on technical analysis & fundamental analysis  https://www.forexadviseclub.com/

Claimant Count Change, UK

Image
-  GBP and its subsequent pairs WHAT'S HAPPENING: Claimant Count Change measures the change in the number of unemployed people receiving unemployment benefits in the U.K. during the reported month. A rising trend indicates weakness in the labour market. A reading that is higher than forecast is generally negative or bearish for the GBP, while a lower than expected forecast reading is usually positive or bullish for the GBP . Follow us to always know the science of  Forex Trading as well as the latest updates on technical analysis & fundamental analysis https://www.forexadviseclub.com/

WHAT IT INFLUENCES: EUR and its subsequent pairs

Image
WHAT'S HAPPENING:    The Retail Sales released by the Euro stat  is a measure of sales changes in the euro zone  retail sector.  The report displays the retail sector performance in the short term by the change in percentage.  The changes are widely accepted as consumer spending indicator. Usually, positive economic growth predicts bullish sentiment for the EUR, while a low reading is seen as negative, or bearish, for the EUR. RBNZ Interest Rate Decision, New Zealand Follow us to always know the science of trading as well as the latest updates on technical analysis & fundamental analysis   https://www.forexadviseclub.com/